Super El Niño Mortality Risk: Vulnerability & Impact
Super-Strong El Niño Could Lead to 450,000 Deaths: Regional Vulnerability and Impact Analysis
I. Introduction
A “super-strong” El Niño represents an extreme phase of the El Niño–Southern Oscillation (ENSO) climate pattern. It is characterized by anomalous, sustained sea surface temperature (SST) elevations across the central and eastern equatorial Pacific. Standard El Niño events disrupt regional weather. Extreme or super-strong events fundamentally alter global atmospheric circulation, amplifying extreme weather anomalies worldwide.
Epidemiological and climatological modeling indicates that a super-strong El Niño event can cause up to 450,000 direct and indirect fatalities globally. These casualties stem from compound hazards: extreme thermal stress, flood disasters, agricultural collapse, vector-borne epidemics, and power grid failures.
Understanding the spatial distribution of risk is essential for public health planning. Regional vulnerability maps combine meteorological hazards with socioeconomic vulnerability, local hospital surge capacity, and electrical grid resilience to highlight areas facing the highest risk of mortality.
II. Mechanics of a Super-Strong El Niño
A. Oceanic and Atmospheric Dynamics
Super-strong El Niño events are defined by oceanic temperature anomalies exceeding +2.0°C in the Niño 3.4 region (5°N–5°S, 170°W–120°W) sustained over multi-month periods.
Normal Conditions:
Trade Winds (East -> West)  ==>  Warm Water Pools in West Pacific (Warm Pool)
Deep Thermocline in West    <==  Upwelling of Cold Water in East Pacific

Super-Strong El Niño:
Trade Winds Collapse/Reverse ==>  Warm Water Shifts Eastward to Central/East Pacific
Atmospheric Convection Shifts==>  Subtropical Jet Stream Strengthens & Displaces Southward
The eastward shift of equatorial warm water weakens the Walker Circulation. The shifted atmospheric convection alters upper-tropospheric Rossby wave trains. This destabilizes the mid-latitude and subtropical jet streams, causing prolonged atmospheric blocking, continuous atmospheric rivers, and extended regional droughts.
B. Historical Precedents
Three major super El Niño events have been documented in modern meteorological history:
| Event Period | Peak Oceanic Niño Index (ONI) | Global Economic Loss (USD) | Primary Severe Impacts |
|---|---|---|---|
| 1982–1983 | +2.2°C | ~$8–10 Billion | Severe droughts in Australia and Indonesia; destructive flooding along the US West Coast and Gulf Coast. |
| 1997–1998 | +2.4°C | ~$35–45 Billion | Historic flooding in California and the southern US; severe Amazon and Southeast Asian forest fires; worldwide coral bleaching. |
| 2015–2016 | +2.6°C | ~$50+ Billion | Record-breaking global surface heat anomalies; widespread drought-induced famine across East Africa; extensive dengue outbreaks. |
Historical data demonstrates that as baseline global temperatures rise, the human and economic impacts of super-strong El Niño events scale non-linearly.
III. Primary Mortality Drivers Behind the 450K Projection
Epidemiological models project up to 450,000 direct and indirect deaths from compounding environmental stressors.
                  ┌────────────────────────────────────────┐
                  │   Super-Strong El Niño Climate Anomaly │
                  └───────────────────┬────────────────────┘
                                      │
        ┌─────────────────────────────┼─────────────────────────────┐
        ▼                             ▼                             ▼
┌──────────────┐              ┌──────────────┐              ┌──────────────┐
│ Extreme Heat │              │ Precipitation│              │ Severe Agro- │
│    Stress    │              │  & Pathogens │              │   Drought    │
└───────┬──────┘              └───────┬──────┘              └───────┬──────┘
        │                             │                             │
        ▼                             ▼                             ▼
┌──────────────┐              ┌──────────────┐              ┌──────────────┐
│Cardiovascular│              │ Vector-Borne │              │ Malnutrition │
│ & Renal Fail │              │& Water Illness│             │ & Famine     │
└───────┬──────┘              └───────┬──────┘              └───────┬──────┘
        │                             │                             │
        └──────────────────────► 450,000 ◄──────────────────────────┘
                               Deaths
A. Extreme Heat Waves and Thermal Stress
Extreme SST anomalies alter tropical circulation, driving persistent high-pressure ridges across continental interiors.
- Wet-Bulb Temperature ($T_w$) Thresholds: Sustained $T_w$ levels exceeding 31°C to 35°C prevent metabolic heat dissipation via perspiration.
- Cardiovascular and Renal Collapse: Chronic heat exposure strains the cardiovascular system, accelerating heart failure, acute kidney injury (AKI), and stroke in older adults and outdoor laborers.
- Urban Heat Island (UHI) Amplification: Dense urban centers retain thermal energy overnight, eliminating nocturnal physiological recovery periods.
B. Vector-Borne and Infectious Diseases
Altered precipitation patterns create environments that accelerate pathogen transmission:
- Mosquito Proliferation: Heavy rain and flooding leave stagnant surface water, accelerating the breeding cycles of Aedes aegypti and Anopheles mosquitoes. This drives localized surges in dengue fever, malaria, chikungunya, and West Nile virus.
- Water Sanitation System Disruptions: Flood-induced sewage overflows contaminate municipal and rural potable water supplies, triggering outbreaks of Vibrio cholerae, Cryptosporidium, and Escherichia coli.
C. Agricultural Disruption and Malnutrition
Teleconnections cause severe, multi-season droughts across major agricultural belts:
- Crop Failures: Reduced staple crop yields (maize, rice, wheat, soybeans) deplete national food reserves.
- Supply-Chain Shock: Production shortfalls lead to price spikes in low-income, import-dependent regions, escalating severe acute malnutrition (SAM) and child mortality.
IV. Geographic Breakdown: States and Regions Hit Hardest
+-------------------------------------------------------------------------+
|                    REGIONAL RISK PROFILE MATRIX                         |
+-------------------------------------------------------------------------+
| REGION            | PRIMARY HAZARD        | SECONDARY RISKS             |
+-------------------+-----------------------+-----------------------------+
| Southwest / South | Extreme Heat Waves    | Grid Collapse, Drought      |
| Pacific Coast     | Atmospheric Rivers    | Landslides, Flash Floods    |
| Southeast Coast   | Coastal Inundation    | Vector-Borne Disease Spikes |
| Midwest           | Convective Storms     | Topsoil Loss, Crop Failure  |
+-------------------------------------------------------------------------+
A. High-Risk Southern and Southwestern States
Primary States: Texas, Arizona, Nevada, New Mexico.
- Hazard Profile: Persistent heat domes, extended dry periods, extreme maximum heat indices.
- Power Grid Fragility: High sustained electrical demand for air conditioning strains thermal generating units and transmission lines, increasing the risk of widespread blackouts.
- Mortality Risks: Grid failures during extreme heat events drive hyperthermia and mortality among medically vulnerable populations.
B. Pacific Coast and Western Flood Corridors
Primary States: California, Oregon, Washington.
- Hazard Profile: An energized subtropical jet stream steers narrow corridors of heavy moisture—atmospheric rivers—directly into the West Coast.
- Secondary Hazards: Catastrophic flash flooding, severe levee breaches, and destabilized slopes causing major mudslides.
- Impact Areas: Central Valley agricultural plains and steep coastal topography, leading to damaged infrastructure and isolated communities.
C. Southeastern Coastal and Hurricane Belts
Primary States: Florida, Georgia, Louisiana, Mississippi, Alabama.
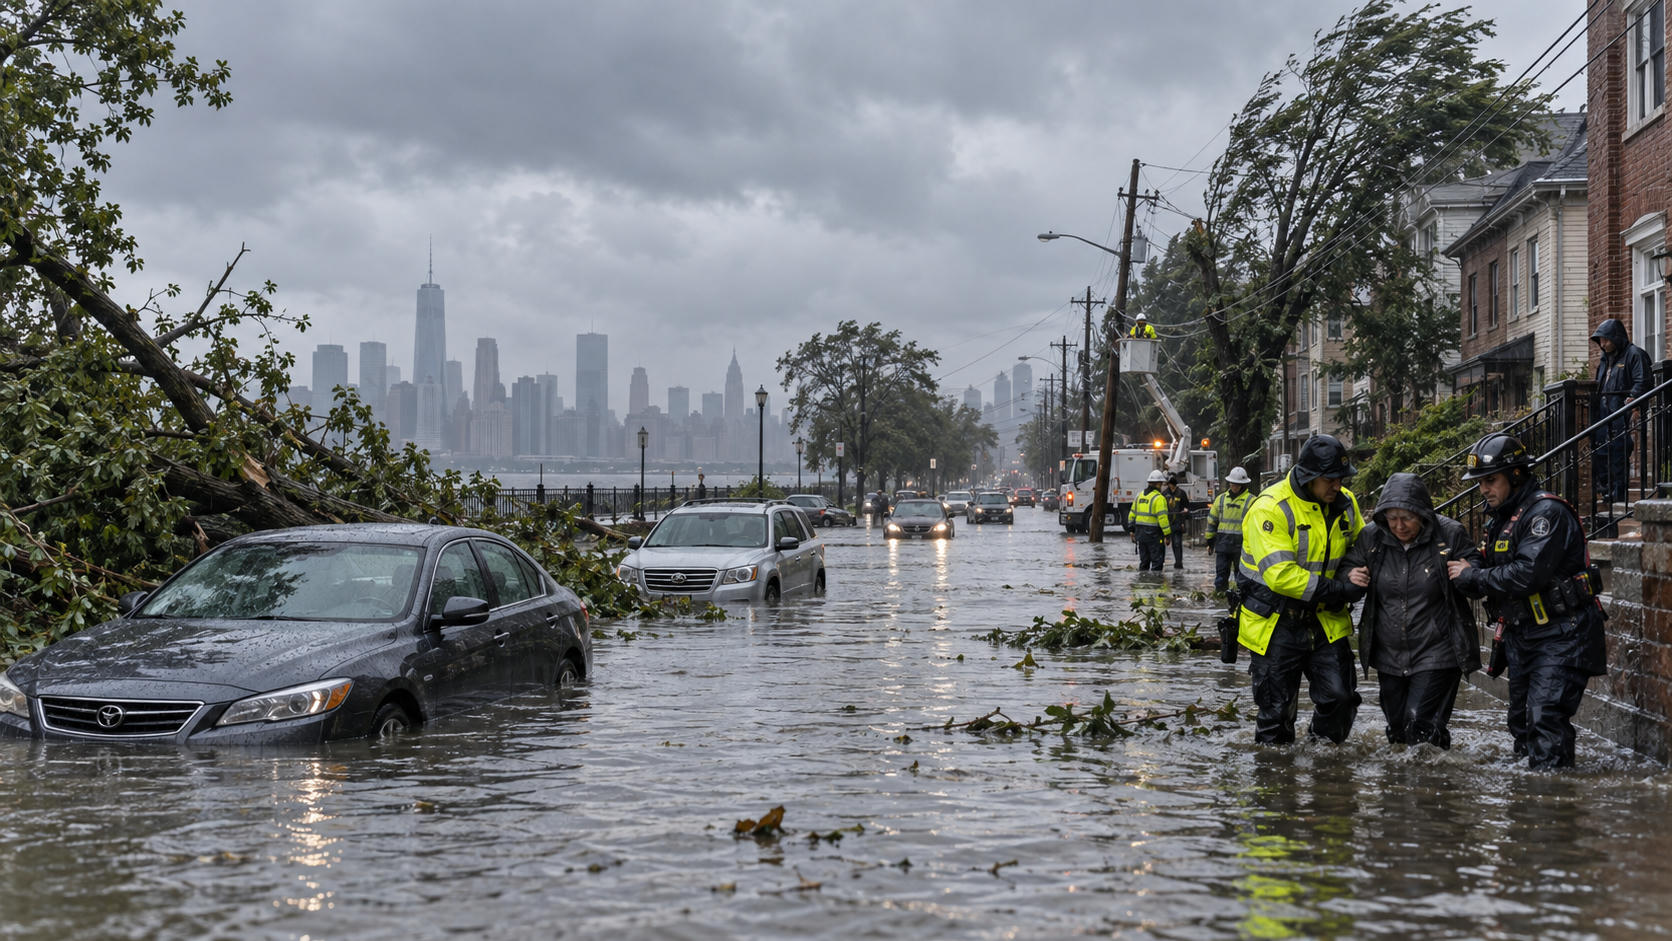
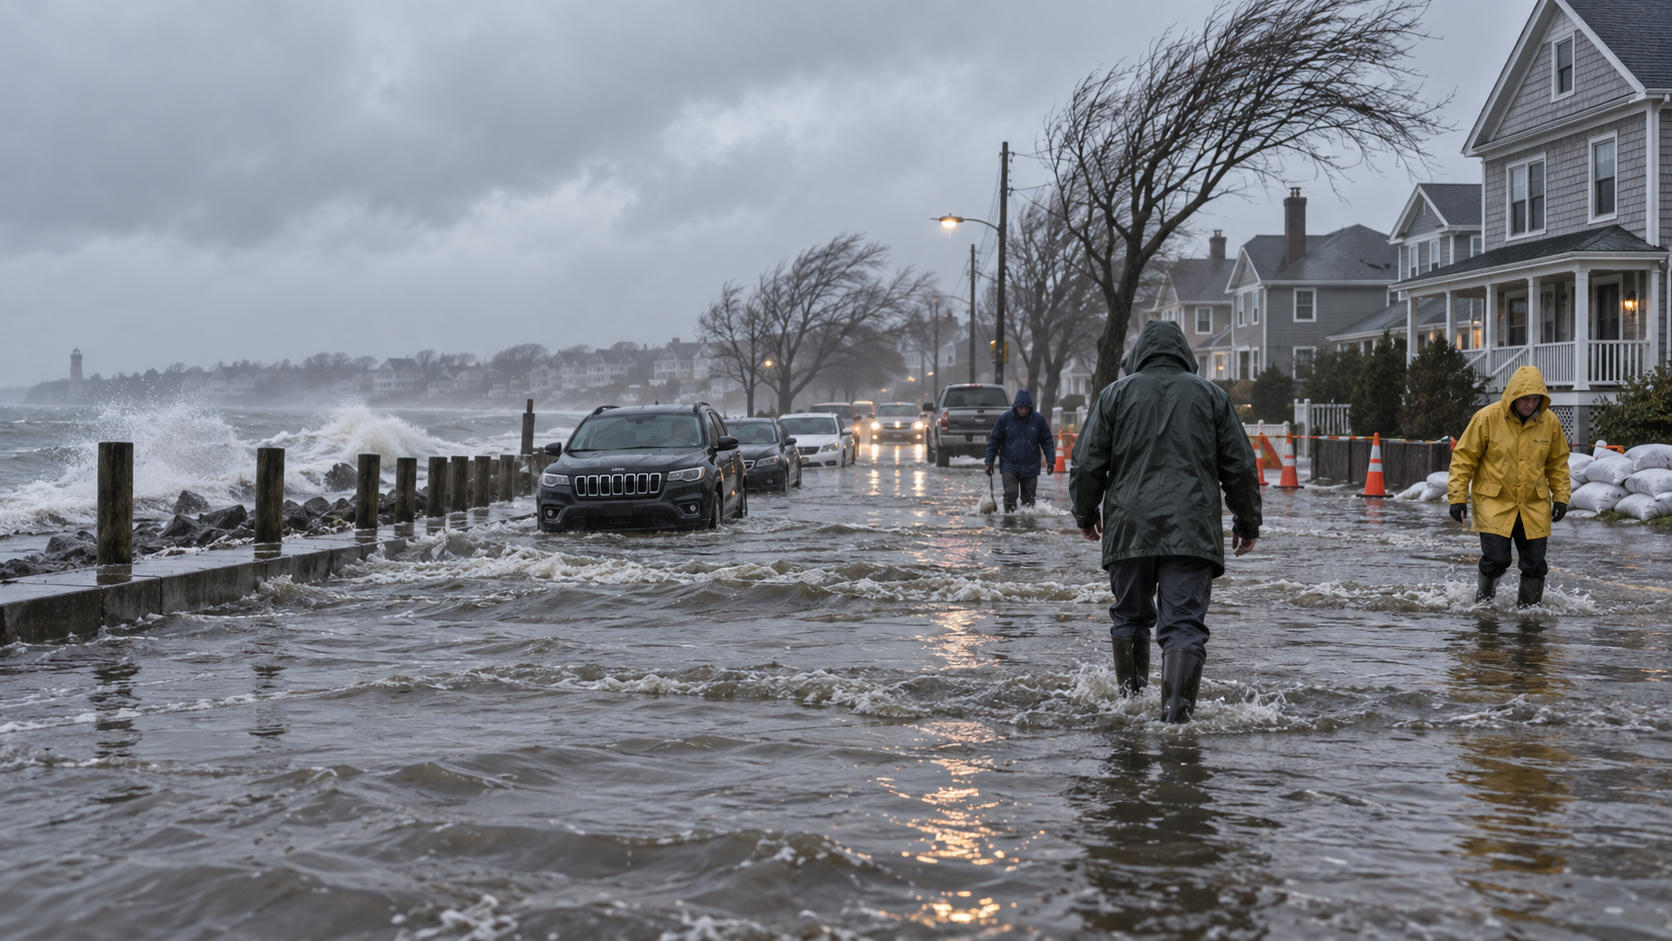
- Hazard Profile: Increased rainfall, saturated soil basins, coastal storm surges, and unseasonal convective severe weather.
- Infrastructure Strain: Inundated drainage systems, prolonged coastal marsh flooding, and compromised wastewater plants.
- Public Health Threat: Acceleration of mosquito-borne pathogens and mold proliferation in flooded housing.
D. Midwestern Agricultural Vulnerability
Primary States: Iowa, Illinois, Indiana, Kansas, Nebraska.
- Hazard Profile: Volatile seasonal shifts, unseasonal freeze-thaw cycles, high-intensity convective storm clusters (derechos).
- Consequences: Loss of arable topsoil, disrupted planting windows, and localized agricultural supply shocks.
V. Regional Vulnerability Mapping and Infrastructure Resilience
+-------------------------------------------------------------------------+
| COMPOSITE VULNERABILITY INDEX CALCULATION                               |
|                                                                         |
|  [ Environmental Exposure ]   (Heat index, precipitation anomalies)     |
|              +                                                          |
|  [ Structural Sensitivity ]   (Grid capacity, levee integrity)          |
|              +                                                          |
|  [ Socioeconomic Factors  ]   (Median age, poverty, chronic illness)    |
|              -                                                          |
|  [ Adaptive Capacity      ]   (ICU beds, cooling centers, backup power) |
|              =                                                          |
|  ===> REGIONAL MORTALITY RISK SCORE                                     |
+-------------------------------------------------------------------------+
A. Mapping Metrics
Regional vulnerability assessments integrate four primary datasets:
- Climatological Exposure: Forecasted frequency and magnitude of temperature and precipitation anomalies.
- Structural Fragility: Age of flood infrastructure, levee load ratings, and electric transmission line limits.
- Socioeconomic Demographics: Density of elderly residents, uninsured populations, and rates of preexisting cardiovascular and metabolic disease.
- Adaptive Infrastructure: Municipal cooling capacity, per-capita intensive care unit (ICU) beds, and emergency backup power penetration.
B. Emergency Medical System Capacity
Simultaneous compound hazards stress regional healthcare systems:
- Hospital Surge Capacity: Power grid failures combined with heat-induced admissions can overwhelm emergency departments.
- Medical Supply Chain Disruptions: Transport corridor closures from floods and landslides delay critical pharmaceuticals, dialysis supplies, and supplemental oxygen deliveries.
VI. Mitigation, Adaptation, and Public Health Response
                              CRITICAL INTERVENTIONS
                                        │
             ┌──────────────────────────┴──────────────────────────┐
             ▼                                                     ▼
   STRUCTURAL ADAPTATION                                EARLY WARNING PROTOCOLS
  ───────────────────────                               ───────────────────────
  • Microgrid deployment                                • Tiered public alerts
  • Water retention capacity                            • Prepositioned supplies
  • Passive urban cooling                               • Targeted vulnerable outreach
A. Structural and Grid Hardening
Municipalities must reinforce critical infrastructure to prevent failures during compounding climate events:
- Microgrid Islanding: Integrate distributed solar-plus-storage microgrids for hospitals, emergency operations centers, and water pumping stations.
- Water Management Infrastructure: Expand stormwater channels, construct decentralized urban retention ponds, and reinforce coastal levees against high-energy flood waves.
- Passive Urban Cooling: Mandate reflective cool roofs, expand urban tree canopies to reduce local surface heat absorption, and retrofit public facilities into designated cooling centers.
B. Early Warning Systems and Community Protocols
To lower mortality risks, state and local authorities must deploy targeted early-action frameworks:
- Predictive Disease Surveillance: Deploy vector surveillance networks to track mosquito breeding zones and target insecticide applications.
- Automated Alert Systems: Distribute multilingual, multi-channel warnings across mobile and broadcast networks ahead of extreme wet-bulb or flood events.
- Community Outreach: Pre-register high-risk, homebound, and medically fragile individuals for direct welfare checks, emergency transport, and mobile medical support during power disruptions.
Frequently Asked Questions (FAQ)
What defines a “super-strong” El Niño event?
A super-strong El Niño occurs when sea surface temperature anomalies in the central and eastern equatorial Pacific (Niño 3.4 region) rise +2.0°C or more above long-term averages. This shift fundamentally alters the subtropical jet stream and disrupts global weather systems.
How do researchers calculate the 450,000 death toll projection?
The estimate uses epidemiological and climatological models that aggregate:
- Direct heat-wave casualties and hyperthermia.
- Flood, storm surge, and landslide fatalities.
- Indirect mortality from vector-borne disease outbreaks, waterborne pathogens, agricultural shortfalls, and power grid failures.
Which US states face the highest risk?
- Southwest and South (Texas, Arizona, Nevada): Extreme heat waves, prolonged drought, and power grid strain.
- Pacific Coast (California, Oregon, Washington): Atmospheric river storms, flash flooding, and landslides.
- Southeast Coast (Florida, Louisiana, Georgia): Severe precipitation, coastal storm surge, and waterborne/vector-borne diseases.
When do the peak impacts of an extreme El Niño typically occur?
Equatorial Pacific ocean warming typically peaks between late autumn and mid-winter. Secondary atmospheric disruptions and peak public health impacts—such as extreme heat, flooding, and vector-borne diseases—unfold through the following spring and summer.
What actions reduce individual and community risk during a severe El Niño?
- Maintain a minimum 72-hour emergency supply kit with non-perishable food, potable water, and emergency medications.
- Identify regional public cooling centers and alternative power sources for essential medical equipment.
- Monitor local National Weather Service (NWS) alerts for heat index advisories, atmospheric river forecasts, and flood warnings.
- Clean local drainage channels, clear debris from home structures, and eliminate standing water around living spaces to limit mosquito breeding.